Two departments open dashboards for the same business and see different totals. Both reports may be technically correct according to their queries. The disagreement can come from different definitions, incomplete records or updates arriving at different times. A new charting tool will not resolve those underlying differences automatically.
Trustworthy reporting begins with the meaning and condition of the data. The business needs to know what a measure represents, where its inputs come from and which limitations affect the result. Data quality work becomes manageable when it is organised around important decisions rather than an impossible promise to make every field perfect.
Define the decision before the dashboard
Ask what action a report is meant to support. A daily workload allocation report and a monthly commercial review may use some of the same records but require different definitions and freshness. Record the intended user, decision and consequence of an incorrect result.
Choose a small number of measures and define them in plain language. What counts as an active customer, a completed job or an outstanding order? State the included states, exclusions and relevant time boundary. Ambiguous terms should be resolved with the owners of the business process.
For a hypothetical service company, a completed job might mean that a technician finished the visit, that the customer accepted it or that all administrative checks are complete. Those are different events. Naming the measure precisely can explain a disagreement before anyone changes a query.
Trace each measure to its inputs
Document the source records and transformations that produce the result. Include manual adjustments, imports and spreadsheets that influence the final figure. A report can be difficult to trust when its most important correction happens outside the visible data pipeline.
Assign an owner to the definition and an owner to the source data process. The same person may hold both roles in a small business, but the responsibilities are different. Someone must decide what the measure means, and someone must address the process that creates incomplete or incorrect information.
Keep the explanation close to the report or maintained data documentation. It should be easy for a new team member to identify the authoritative definition rather than choosing between several similarly named exports. Changes to a definition deserve review because they can alter the interpretation of historical comparisons.
Evaluate quality against the intended use
Consider whether the information is accurate, complete, timely, consistent and valid for the decision being made. The Government Data Quality Framework provides useful dimensions for discussing these issues. A business can apply those concepts without adopting every process described for government data.
Prioritise fields whose quality changes the outcome. A missing optional description may have little effect on an allocation decision, while an incorrect scheduled date can send work to the wrong team. Treating every missing field as equally important can consume effort without improving the report's usefulness.
Distinguish unknown information from information that is genuinely absent or not applicable. Replacing every blank with a default value can make a report look complete while obscuring uncertainty. Preserve the distinction where it affects interpretation and explain how the report handles it.
Find errors at the point where they enter
Profile the source data for patterns such as duplicate identifiers, invalid relationships and inconsistent status combinations. Investigate where those patterns originate. A recurring issue may come from a confusing form, a supplier feed or a rule that different departments interpret differently.
Improve validation or workflow design where the business can prevent the problem. A required field alone may not help if users enter a placeholder because they do not know the value. The process might need a legitimate pending state or a clearer ownership step instead.
Keep corrective rules explicit. If a pipeline merges duplicates or normalises values, record how it decides and how ambiguous cases are reviewed. Silent corrections can create their own errors, particularly when records that look similar belong to different real-world entities.
Make freshness and reconciliation visible
Display when the report's source information was last refreshed and what period it covers. Separate the refresh time from the date of the underlying business event. A recently refreshed dashboard can still contain old source records if an upstream integration has stopped updating them.
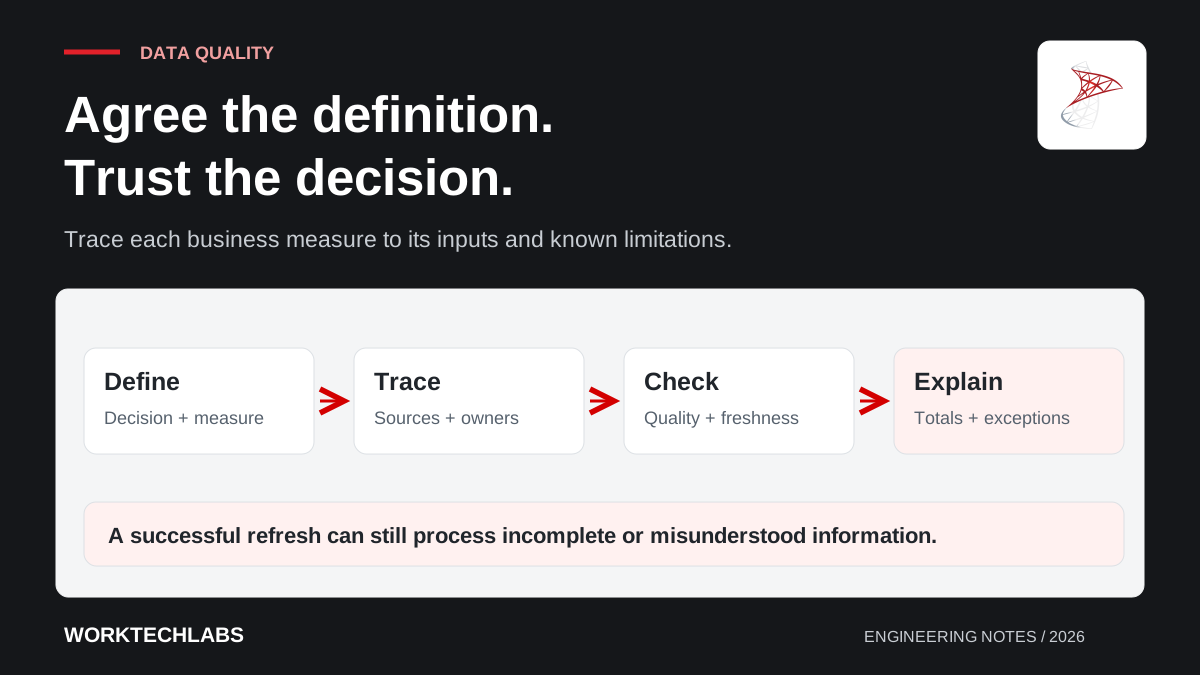
Reconcile important totals and relationships against agreed reference points. Compare the set of expected records, relevant control totals and exceptions rather than only checking that the pipeline completed. A successful refresh may have processed an incomplete file perfectly.
Give users a way to inspect a discrepancy at an appropriate level of detail. If an operations total changes unexpectedly, the responsible person should be able to identify the records and rules contributing to it. Access to that detail must still respect the application's permissions.
Handle corrections and historical meaning deliberately
Decide whether a report reflects the latest corrected truth or the information known at a past point in time. Both views can be useful, but they answer different questions. A historical snapshot and a recalculated historical measure should not be presented as interchangeable.
Record important corrections with their reason and source where the workflow requires traceability. This helps explain why a figure changed after a report was first reviewed. It also prevents teams from treating every movement in a historical total as a technical defect.
Review how changes to categories, customer structures and business rules affect comparisons. A new definition may require restating earlier periods or clearly marking a break in the series. The reporting owner should make that decision with the people using the measure.
Build a quality improvement loop
Track a small set of quality issues linked to business impact. Give each an owner, a corrective action and a way to determine whether it improved. Avoid producing a large quality score that nobody can connect to a specific decision or process.
Use support questions and recurring reconciliations to identify where definitions remain unclear. Sometimes the next improvement is better documentation; sometimes it is a change to the data-entry workflow or integration. Keep the response tied to the cause rather than repeatedly repairing the same report output.
Worktechlabs helps businesses connect operational systems and data and build ERP workflows that produce information people can verify. Better reporting begins when the business can explain its measures, trace their inputs and show how known quality issues are being addressed.