An application can look healthy on a server dashboard while failing the people who use it. The homepage loads, CPU usage is modest and the process is running, but customers cannot complete a booking because a background message is stuck. Resource monitoring is useful; understanding the service requires a view of the work moving through it.
Observability helps a team investigate what the application is doing and why. Planning it before launch means deciding which user journeys matter, what evidence those journeys produce and how someone will respond when the evidence shows a problem. This is product work as well as infrastructure work, because the right signals depend on what the application is meant to accomplish.
Begin with the journeys customers depend on
Choose a small set of important workflows. For a customer portal, these might include signing in, finding an authorised record and submitting a request. For an internal operations system, they might include importing orders, allocating work and generating an invoice. Define what successful completion means for each journey.
List the dependencies along the route: identity provider, application, database, queue and external service. Identify where failure can be returned to the user and where work continues in the background. A request accepted by the frontend is not the same as a job completed by a worker several minutes later.
Ask the business how long a delay can remain unnoticed before it creates a problem. That answer helps prioritise monitoring. A weekly report can tolerate a different response from a customer transaction that must complete while the person waits. Avoid applying the same alerting rule to every component simply because the monitoring tool makes it easy.
Give logs, metrics and traces different jobs
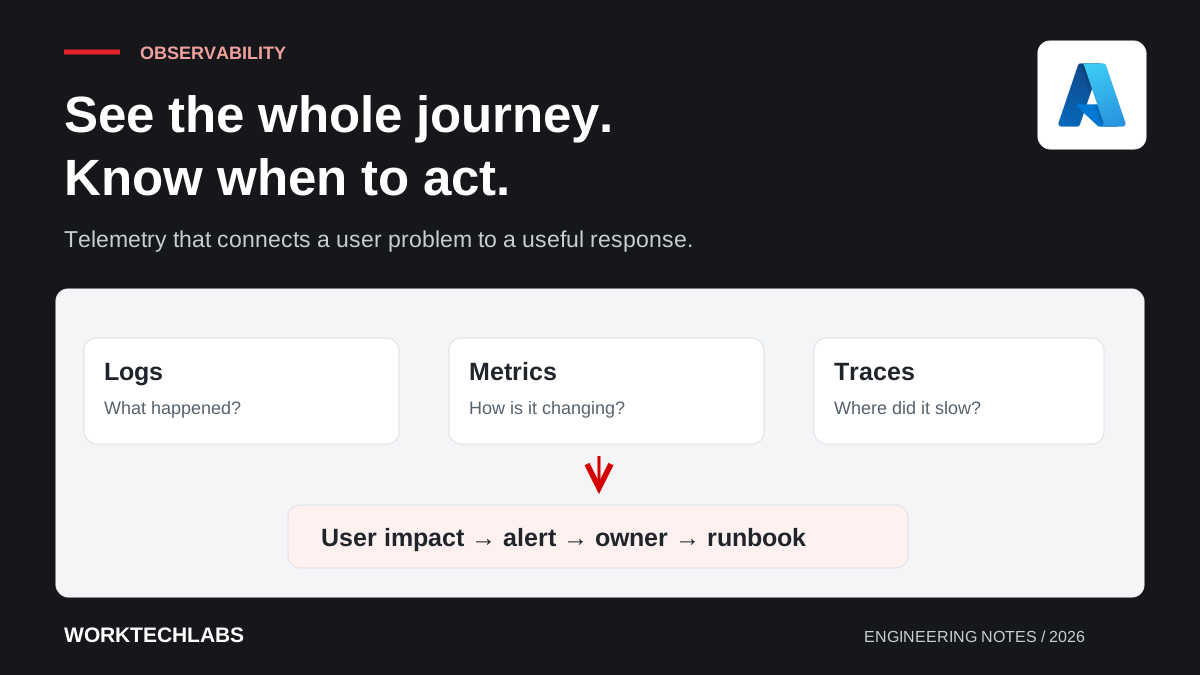
Logs record events with useful context. Metrics describe quantities over time, such as request duration, error rate or queued work. Traces connect related operations across components so an engineer can follow a request through the system. OpenTelemetry documents these telemetry signals and provides a common approach to producing them.
Use structured fields rather than relying entirely on free text. An operation name, application version and correlation identifier can help join evidence from several services. Choose fields that support investigation while avoiding unnecessary personal information or sensitive payloads.
These signals complement one another. A metric may reveal that order processing is slowing down, a trace may show time spent waiting for a dependency, and logs may explain why a particular operation was retried. Collecting more of everything is less useful than ensuring the team can move between these views to answer a question.
Connect a request to the work it creates
Assign a correlation identifier at an appropriate entry point and propagate it through related calls and messages. When a user reports a failed operation, support staff should be able to find the relevant evidence without searching every log file manually. Expose a safe reference to the user where that helps investigation.
Asynchronous work deserves particular attention. Record when a job was accepted, started, completed or moved to an exception state. Track retries and make duplicate processing visible. A queue that contains little work now may still be hiding one old message that has failed repeatedly.
For a hypothetical supplier import, the user could see an upload reference and processing status. Engineers could use the same reference to follow storage, validation and database writes. The business gets an understandable explanation, and the team gets a route from the report to the relevant technical evidence.
Define a small service health model
Choose indicators close to user experience. Examples include successful completion of a transaction, response latency and the age of the oldest pending job. Resource measures such as memory and CPU can support diagnosis, but they do not automatically define whether the service is useful.
Set objectives with the people responsible for the product. State the measurement window and what counts as a success or failure. An availability target means little if the team has not agreed which requests are included or how partial failures are counted. Keep the first model simple enough that everyone can explain it.
Avoid promising a numerical target before understanding the workload and operating arrangements. A target creates expectations about engineering investment and response. Establish a baseline, understand recurring variation and then choose objectives the business needs and the team can support.
Alert only when someone should act
An alert should identify an actionable condition, its likely impact and the next step. Decide who receives it, how urgently they should respond and what happens if they are unavailable. A notification with no owner is simply another event waiting to be noticed.
Use thresholds and evaluation windows that account for normal variation. A brief isolated error may not need an urgent page, while a sustained failure in a critical journey does. For low-volume workflows, an explicit synthetic check may be more useful than a rate based on very few requests.
Review noisy alerts. If responders repeatedly acknowledge a notification without taking action, investigate whether its threshold, routing or purpose is wrong. Preserving every alert can feel cautious, but it makes the remaining signals harder to use. Keep informational events available for investigation without giving all of them the same urgency.
Write runbooks for decisions, not just commands
A useful runbook starts with the symptom and the effect on users. It explains what evidence to inspect, which actions are safe and when to escalate. Include links to the relevant dashboard, deployment record and dependency status where possible.
Describe the consequences of recovery actions. Restarting a worker may interrupt processing; replaying a message may create a duplicate unless the application handles it safely. The responder needs that context before taking action, especially when they are supporting a component they did not build.
Test the runbook with someone other than its author. If they cannot find the logs, identify the deployed version or obtain the required access, the document has revealed a useful gap. Resolve those gaps before an incident turns them into delays under pressure.
Balance diagnostic value with cost and privacy
Decide what information is necessary to investigate the application and how long to retain it. Avoid logging passwords, access tokens or entire customer documents. Redaction and access controls should be part of the telemetry design rather than a cleanup task after logs have spread across systems.
Control volume deliberately. High-cardinality metric labels, verbose request logging and large payloads can increase cost and make analysis harder. Keep detailed information where it answers a diagnostic question, and use appropriate aggregation or sampling where that preserves the evidence you need.
Document what sampling can hide. A trace view containing only selected requests should not be mistaken for a complete record of every transaction. Business audit requirements may need a separate, explicitly designed record rather than relying on operational telemetry that can be sampled or expire.
Rehearse failure before the first important release
Exercise a small set of realistic conditions in a suitable environment: an unavailable dependency, an invalid configuration, a delayed job and a failed deployment. Check whether the monitoring detects the problem, whether the notification reaches the right person and whether the runbook leads to recovery.
Include a user-facing check after recovery. A process can be running again while queued work remains stuck or records require reconciliation. The test should end when the important workflow is usable and the team understands any outstanding effects.
Worktechlabs helps teams design support and maintenance around their applications' real workflows. Combine observability with safer deployment practices so every release produces evidence about the service, and the team has a practical way to act when that evidence changes.